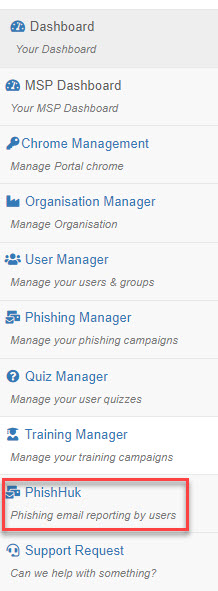
As a customer admin, you can see reported emails and configure certain aspects of PhishHuk by selecting the PhishHuk tab in the left panel of your dashboard.

When you open your PhishHuk dashboard, you can immediately see the latest number of reported emails:

From the top of your dashboard, you can access the following tabs:
-
Dashboard: If you are in another tab, you can select Dashboard to return you to your PhishHuk Dashboard.

-
Inbox: This displays the list of reported emails. When you select an email, you have the option to view it and add a note.

The following actions are also available in the Inbox section:
Copy: Allows you to copy the table.
CSV: Exports the table as a CSV (Comma-Separated Value) file.
Excel: Exports the table as an Excel (xlsx) file.
-
Search Panes: Displays a pop-up window with Search fields and Sort options.

Templates: In this section, you can define the templates that are sent to the admin when an email is reported and also the email you wish to send to the user reporting the email as acknowledgement of their awareness.
-
Settings: You can configure PhishHuk here by selecting the following tabs:
General: Stop the ingestion of emails and also redact emails.
Scanning: Configure what is to be scanned when emails are reported.
Reporting: Set the acknowledgement and select recipients of reports.
Exchange: Set up how emails are handled after they are reported, such as Delete, Move, and so on.
Support: From here, you can send a request or query to the SafeTitan Customer Support team.
Addins: When you select Addins, you'll find links to documentation to help you add PhishHuk to your Microsoft Outlook 365 Ribbon bar.
Legacy PhishHuk: List of current PhishHuk reports and a legacy overview of PhishHuk.


.png)
 1.png)